Small Business Statistics in 2024

Fact Checked
Small businesses are the lifeblood of the US economy. While big corporations tend to get more attention from the public, it is the small businesses that make the most impact. On top of that, the majority of the workforce is employed by small businesses.
Whether you’re a business owner or simply interested in business trends, understanding the current statistics for small businesses is important. Not only will these statistics help you understand the current state of business, but they will shed light on what the future may hold.
Key Takeaways:
- 99.9% of American businesses are small businesses
- There are around 33.2 million small businesses in the United States
- 61.7 million Americans are employed by small businesses
- 43.2% of small businesses are women-owned
- 74% of small business owners report their costs have gone up over the previous year
Small Business Statistics in 2024
Generally, a business is considered small when it’s independent and has fewer than 500 employees. Additionally, the US Small Business Administration defines small businesses by their firm revenue, ranging from $1 million to over $40 million.
The vast majority of businesses in America are considered small.
- 99.9% of American businesses are small businesses.
- There are around 33.2 million (33,185,550) small businesses in the United States.
- California is home to the most small businesses.
Small businesses have created many jobs for the American people for decades.
- 61.7 million Americans are employed by small businesses.
- 46.4% of private sector employees are employed by small businesses.
- From 1995 to 2021, small businesses created 17.3 million net new jobs. That’s 62.7% of net jobs created since 1995.
- According to the SBA, small companies create 1.5 million jobs every year, which is 64% of all new jobs created in the US.
The spirit of entrepreneurship is not slowing down either. People filed nearly 2.7 million applications to start a business between January and June of 2023. This was a 5% increase from 2022 and a staggering 52% increase from the same period in 2019.
In September 2023 alone, there were 472,961 business applications submitted, which was an increase of 1.3% compared to August 2023. Small companies are good for economic growth as well.
- 32.6% of known export value is generated by small businesses.
- Small organizations account for 44% of US economic activity.
- 43.5% of US gross domestic product (GDP) is delivered by small businesses.
- Small business acquisitions grew 2% year-over-year in Q3 2023.
However, the small business optimism index (which indicates the overall health of small businesses in the USA) fell 0.8 points in March to 90.1. The series average is 98.2, and there has been a steady decline for 15 consecutive months.
Women-Owned Business Statistics
More and more women are venturing into the business world. However, despite making leaps toward equality, women in business still face inequality. Luckily, that is not enough to keep women leaders out of the space.
- 43.2% of small businesses are women-owned.
- $388.1 billion in revenue is generated by women-owned small businesses.
- 10.1 million workers are employed by women-owned small businesses.
- States with the most women-owned employer firms are Hawaii, Virginia, and Colorado.
- Female-owned businesses grew 0.6% since last year and 21% over the past five years.
- Over 1,800 new women-owned companies are created each day in the US.
Despite making large strides towards equality, women business owners have experienced gender-based discrimination.
- Nearly 1 in 3 (32%) female entrepreneurs have experienced sexism as business owners.
- The average loan size for women-owned firms is 50% lower than for male-owned.
- Only 2.4% of venture capital funding goes to female founders in the US.
As such, the top priority for many women-owned businesses is to get more funding and financial help—especially since about 53% of these businesses are funded by personal savings.
Women are also less involved in trade and export than men are. Only around 11% of women-led firms exported in 2022, compared to 19% of male-led firms. Even when we consider that women-led firms are generally smaller and more likely to offer services rather than goods, the gap remains.
Some women business owners also face the additional responsibility of children at home.
- 31% of women business owners have school-aged children at home.
- About 61% of women owners say that school closures have impacted their business.
- 30% reported scaling back due to childcare needs.
- Before the pandemic, around 6% of women leaders offered childcare benefits, but post-pandemic, 14% planned to offer childcare benefits.
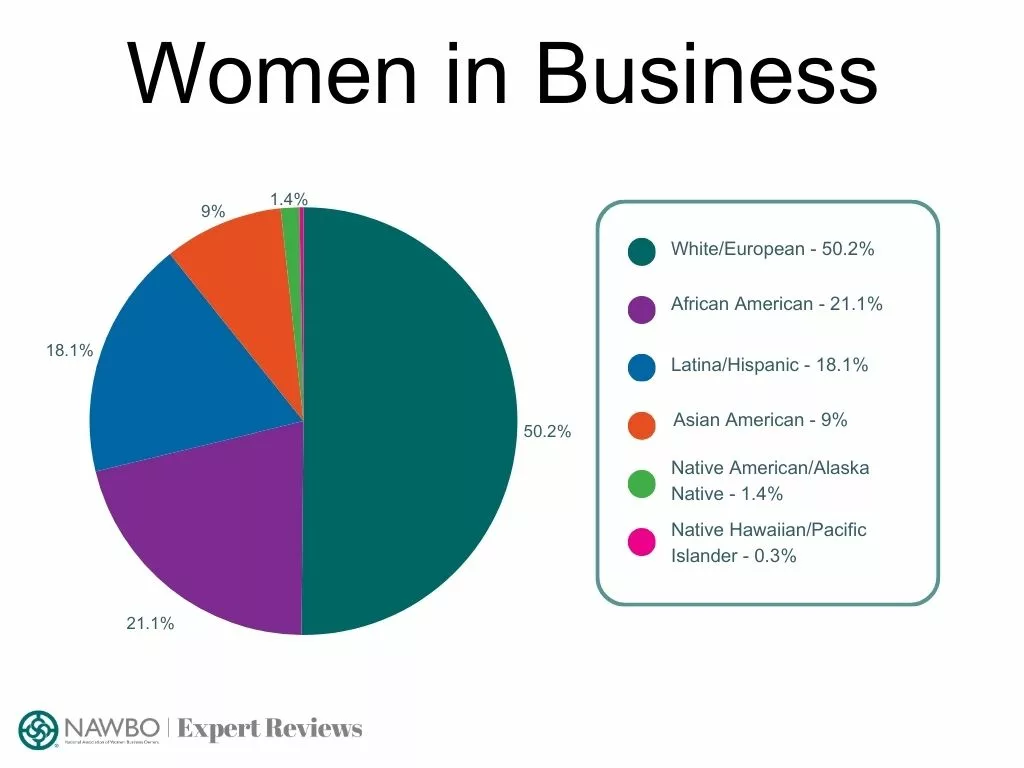
In what used to be a world limited to rich white men, entrepreneurship is now open to anyone willing to risk the restless waters. Women from all walks of life and cultures are venturing into the business world, and while there is not an equal distribution yet, we are further than ever before.
Currently, women of color operate about half of all women-owned businesses.
However, their innovation and drive are continuous, bringing jobs to millions of people.
- Women of color represent 39% of the total female population in America, yet they account for 89% of the net new women-owned firms per day.
- 6.4 million women-of-color-owned businesses in the US employ around 2.4 million people.
Women-owned businesses bring much-needed diversity and innovation to corporations. However, they face many unique challenges. That’s why supporting women-owned businesses, whether through social media engagement or patronage, is vital.
Small Business Demographics
Small businesses are the most common type of business. As such, all different types of companies exist throughout the country. In this section, we look at business statistics based on their location, industry, and people.
The Location of a Business
As the saying goes, “Location, Location, Location” is one major factor in the success of a business.
- Massachusetts, Louisiana, and California have the highest success rates.
- Michigan, Washington, and Kansas, on the other hand, have the highest failure rates.
Some US regions have proved more profitable for businesses owned by people of color as well.
- 71% of Black-owned businesses are east of the Mississippi.
- One-third of black-owned businesses are clustered in the South Atlantic region.
Additionally, the Pacific region (AK, HI, WA, OR, and CA) saw an increase in non-white businesses:
- Black-owned businesses increased by 4 points.
- Asian-owned businesses increased by 4 points.
- Hispanic-owned businesses increased by 3 points.
The East North Central region (WI, IL, IN, MI, and OH) also saw an increase:
- Black-owned businesses increased by 5 points.
- Asian-owned businesses increased by 3 points.
- Hispanic-owned businesses saw no recent change.
Most businesses don’t start in the best location, however. The US Small Business Administration (SBA) reports that most businesses start in the home.
- 50% of all businesses start at home.
- 60% of all businesses without staff are home-based.
- Therefore, 19 million US businesses are home-based.
Small, local businesses are also important to rural communities.
- 84.8% of rural establishments are operated by small businesses.
- They employ 54.3% of workers.
However, the rate of rural small business employment growth is much slower than that of large rural corporations:
- Rural small business employment grew only by 1% between 2012 and 2019.
- Employment for large rural businesses grew 12.9% in those years.
Business Statistics by Industry
All types of businesses exist, but some have better chances than others.
- Healthcare has the highest success rate, with 60% of businesses surviving their first year.
- The transportation and warehousing industry has a 40% first-year survival rate.
- Construction has the lowest first-year survival rate at 30%.
Interestingly, around 25% of Black-owned businesses have been in health care and education. While 25% of Hispanic-owned businesses have been in “non-manufactured goods production and services.” This includes industries like agriculture, construction, and transportation.
Business interest in agriculture is growing significantly. In September 2023, 9,456 applications for starting an agriculture business were filed, an 86.6% increase from August 2023.
While interest in agriculture is growing, it is not one of the top five industries in the United States. Of the 33.2 million small businesses in the US, these are the top five industries, along with the number of companies, according to the US Small Business Administration Office of Advocacy.
- Professional, Scientific, and Technical Services – 4,594,752
- Other Services (except Public Administration) – 3,554,298
- Construction – 3,483,077
- Real Estate and Rental and Leasing – 3,268,764
- Transportation and Warehousing – 3,051,341
These numbers include companies with no employees, 1-19 employees, and 20-499 employees.
Types of People in Business
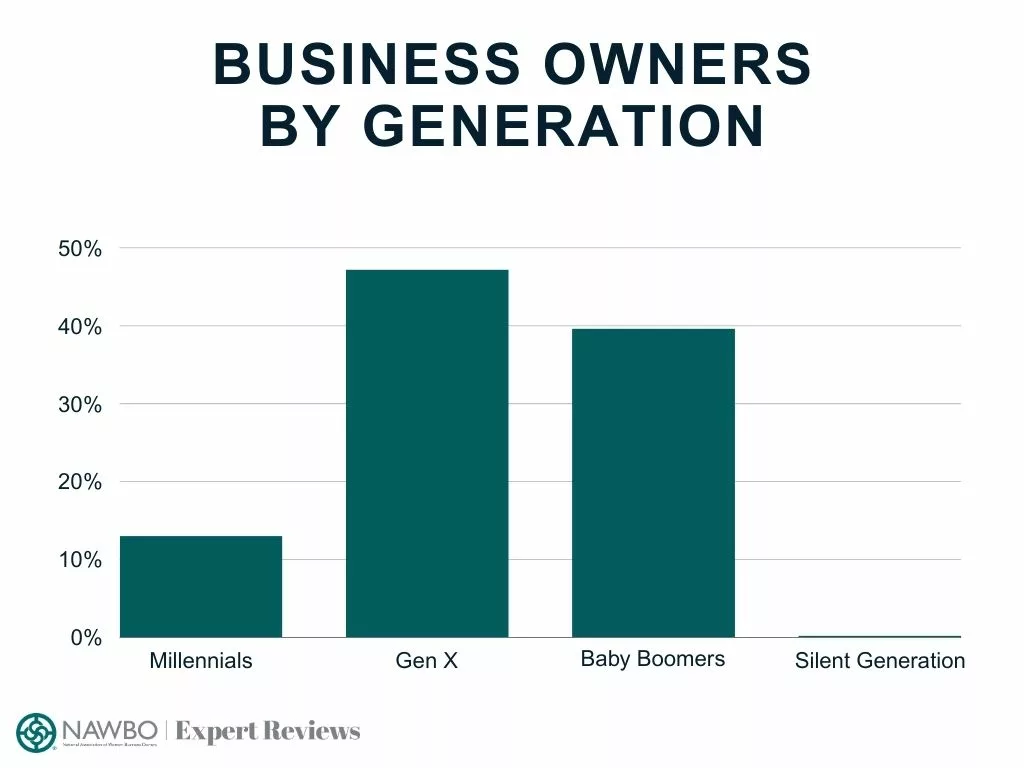
People of all ages and ethnic backgrounds have been entering the world of business in recent decades. Currently, the majority of business owners are from Gen X and the Baby Boomer generation.
- 13% of Millennials are business owners.
- 47.20% of Gen X are business owners.
- 39.63% of Baby Boomers are business owners.
- 0.25% of the Silent Generation (born between 1928 and 1946) are business owners.
Now that we have a general understanding of which generations have the most business owners, we can look at the minority-owned business statistics.
- Since Jan. 2020, the number of self-employed people of color has risen 13%.
Additionally, interest in startups has increased, too. There are two ways to classify a startup: Employer firms and nonemployer firms. An employer firm is a business with 1-499 employees. A nonemployer firm has no employees, and only the owner(s) of the firm work there. Using these metrics, we can look at the race demographics for each type.
| Employer Firms | Non-Employer Firms |
| 73% white | 62% white |
| 13% Hispanic | 20% Hispanic |
| 8% Asian | 13% Black or African American |
| 6% Black or African American | 5% Asian |
| <1% Native American or Alaskan Native | <1% Native American or Alaskan Native |
According to a recent annual business survey cited by the US Chamber of Commerce, there are quite a number of businesses owned by minority groups.
- Asians own around 581,200 small businesses and account for about 23.8% of the accommodation and food services sectors.
- Hispanics own around 346,836 of all businesses and have an estimated $463.3 billion in annual receipts (which reflect the actual cash flow of transactions).
- African Americans own around 134,567 small businesses, and about 29.5% of these are in the social assistance and healthcare sectors.
- Alaska Natives and Native Americans own around 26,064 businesses with $35.8 billion in annual receipts.
Additionally, the same study found that Veteran-owned businesses account for 5.7% or 331,151 of all small businesses. These businesses have 963.4 billion in receipts and employ around 4 million employees.
Problems Facing Small Businesses
Running a business is no easy task, and there are many obstacles and complications owners have to navigate. Inflation is a significant concern for most business owners.
- 74% say their costs have gone up over the previous year.
- 52% of businesses say inflation is their number one concern (a 30% increase since 2021).
Similarly, the tough labor market negatively affects small businesses.
- 47% say the market is not improving.
- 48% say recent increases in state minimum wage have hurt their business.
The minimum wage has increased by over $5 in some areas. On top of every other increasing business cost, owners of small companies are struggling to stay afloat.
Another major issue business owners face is finding skilled talent. A survey asked owners to share their biggest struggles with the workforce. Of those respondents:
- 22% reported recruiting and retaining is one of their biggest challenges, in addition to inflation.
- 27% of business owners report there is a lack of interest in the workforce and a low number of applications
- According to the National Federation of Independent Business (NFIB), 43% of all small business owners reported job openings they could not fill.
- 12% of owners struggle to find candidates with the right technical skills.
- 11% of owners struggle to find candidates with the right soft skills.
Some challenges business owners face happen before they even start their business. Starting a business is expensive, and the vast majority of entrepreneurs need funding. However, it can be difficult to get aid from some lenders if they view you as a high credit risk.
- 23% of Black-owned firms had a high credit risk.
- 15% of Hispanic-owned firms had a high credit risk.
- 6% of White-owned firms had a high credit risk.
- 4% of Asian-owned firms had a high credit risk.
Overall, though, around 41% of startups of color were low credit risk.
However, SBCS data suggest paid professionals were less common among firms owned by people of color than they were among white-owned firms, as just 45% of firms owned by people of color reported having a paid professional in their network as opposed to 64% of white-owned businesses.
Business Survival Rates
An average of 4.4 million businesses start every year; however, nearly half of those fail by their fifth year.
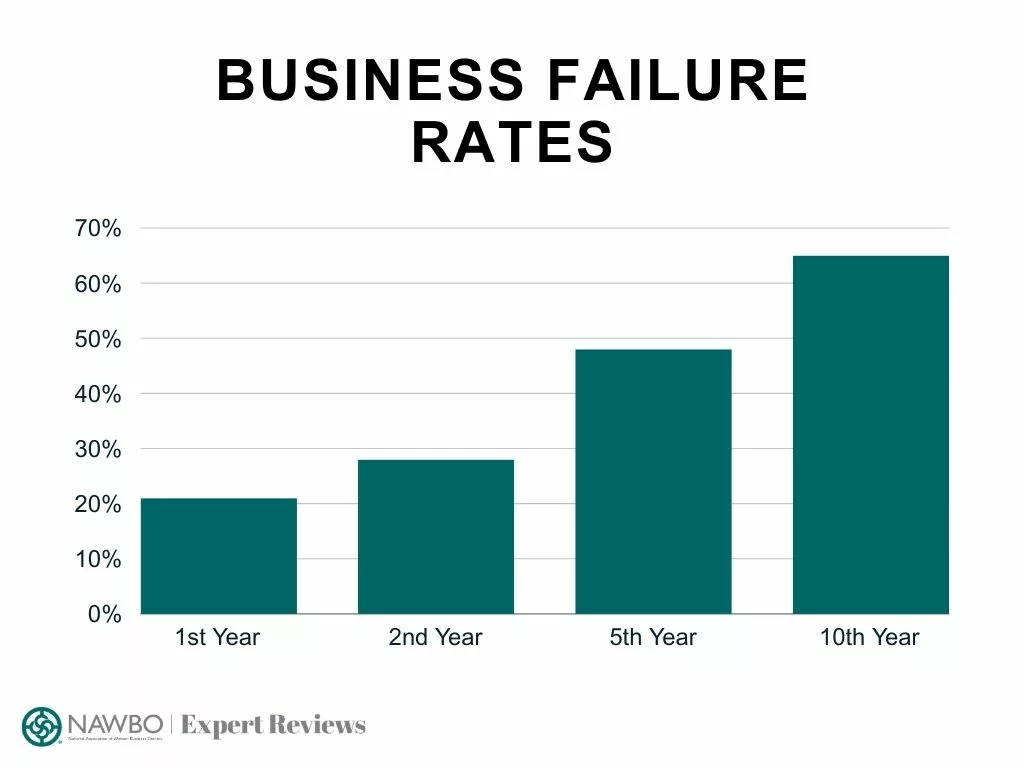
The most recent statistics show that:
- 21% of companies fail by their first year.
- 28% fail by their second year.
- 48% by their fifth year.
- 65% fail by their tenth year.
Interestingly, the technology industry has the highest failure rate. Around 75% of all fintech startups crash within two decades. Across all industries, 90% of all startups fail, and 10% don’t survive their first year.
There are many reasons why companies fail. Below are among the top reasons:
- Poor marketing strategies
- Inadequate management
- Financing hurdles
- Unproductive business planning
Around 22% of companies that fail don’t have a sound marketing strategy. Another 34% fail due to a lack of proper product-market fit. One-third (33%) of businesses also fail or experience challenges due to a lack of capital.
Small Business Financial Aspect
Running a business is not cheap. Small business owners have many expenses they have to keep track of, and it can be stressful. Below are just a few financial challenges business owners face throughout their careers.
- 16% of businesses are funded by bank loans
- 2-6% of initial small business funding comes from loans from family and friends.
- SBA loans have a 25% approval rate at large banks.
- SBA loans have a 49% approval rate at small banks.
- 28% of employer startups of color receive funding from financial institutions.
However, as more people grow interested in starting a business, more people go to the banks for funding. On top of that, interest rates are constantly increasing. An unfortunate side effect of this is a decrease in approved loans. In February 2023, only 14.2% of business loan requests were granted. However, the year before, 28.3% of requests were granted.
Female business owners are given smaller loans than men on average. A 2022 study found that the average loan size for women-owned businesses is $49,712, which is 50% lower than those given to men-owned businesses at $83,198.
While 78% of small business owners use their own funds to launch their businesses, most don’t have enough money to begin. One survey asked startup owners how much their beginning costs were:
- Most (27.3%) said their costs were between $250k to $500k.
- The second highest (16%) said their costs were between $500k to $1 million.
However, according to The Ewing Marion Kauffman Foundation, the estimated average cost of starting a small business is $30,000.
On top of all the beginning expenses, businesses must pay for equipment, taxes, rent, payroll, and more.
- Interestingly, small businesses pay 39.4% percent of private sector payroll.
Other interesting financial statistics are the average incomes for self-employed owners of small businesses:
- The average income for a self-employed owner is $51,816 per year.
- The average income for an owner of an unincorporated business is $26,084 per year.
The SBA does state that some of these results may be skewed as many entrepreneurs use their skills in side gigs and are not fully self-employed.
Future Predictions of Small Businesses
With the current state of the economy, many small businesses face uncertainties about the future. With financial strain, skyrocketing interest rates, labor shortages, and supply chain issues, doing business is a highly challenging task.
- One survey found that 11.86% of business owners plan to sell their business by the end of 2023.
- Yet, 48.61% plan to grow their current location, service, or website.
- 11.13% of business owners actually plan to open a new location despite economic concerns.
Luckily for those few business owners, the Census Bureau projects that 32,219 new business startups with payroll tax liabilities will form within four quarters of application.
The future of business, though full of obstacles, is not dire. One article from LinkedIn gives tips on how business owners can plan ahead and continue strong in the coming years.
The Bottom Line
Small businesses are the lifeblood of the United States. They comprise the majority (99.9%) of businesses in America. They employ 61.7 million Americans, bringing jobs and economic growth. However, life for a small business owner is full of obstacles. Understanding the statistics, both current and how they’ll change, will give owners a better chance at navigating the business world.
About NAWBO Expert Reviews
NAWBO Expert Reviews is a software review and recommendation service that empowers small and medium-sized business decision-makers with free tools and expert reviews.
Fair Use Statement
We welcome you to share our research for noncommercial purposes, but please provide a link back to the article so people can fully access our report.
About the Author

Gabrielle Carpenter
Writer, NAWBO Expert Reviews
Gabrielle focuses on market research and industry trends for the NAWBO Expert Reviews Team. Through her work, she empowers small business owners with the information they need to make smart purchasing decisions.
How to Cite this Article
NAWBO Expert Reviews. “What Percentage of Businesses are Small Businesses?” NAWBO.org. Feb. 9th, 2024, https://nawbo.org/expert-reviews/small-business-statistics/.